Displaying Likert rating data with D3.js
I was recently looking at approaches to handling the web-based visualisation of survey data that asked users to rate their answers on a 7-point scale.
Using D3.js, and based on previous work by Asif Rahman visualising groups of journals, this is what I came up:
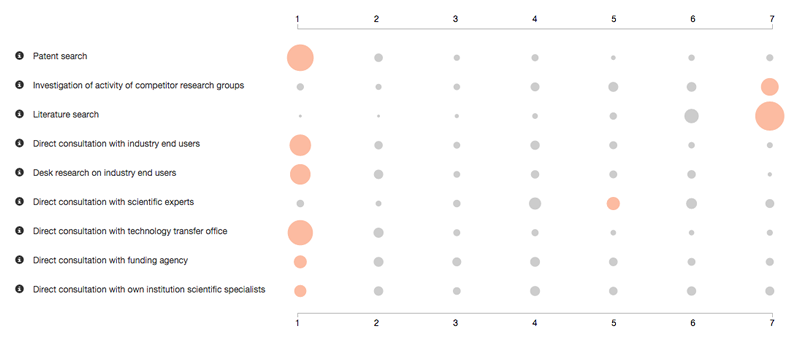
The highlighted circles are the ones that have the most ratings for each question, with circle sizes being proportional to the number of responses it got.
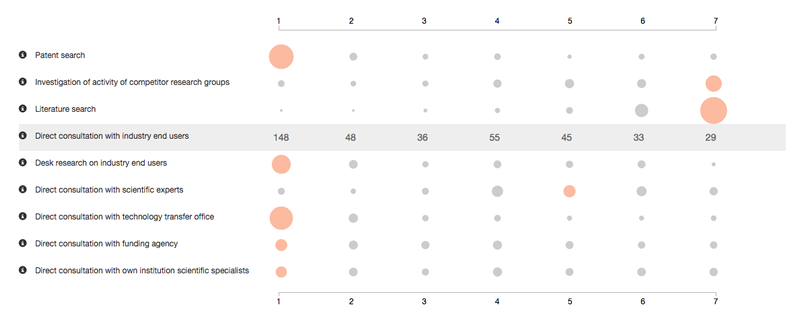
The chart is also interactive – when the user places their mouse over the text label, they will see the values for all associated ratings. Placing the mouse over one of the individual circles will display the number of responses for that rating.
The code to create the charts is available on Github – there are a number of potential improvements listed there. Pull requests are welcome :)